Nautical chart prints · Drowned Coast
Your home as a sea chart, if the sea came inland.
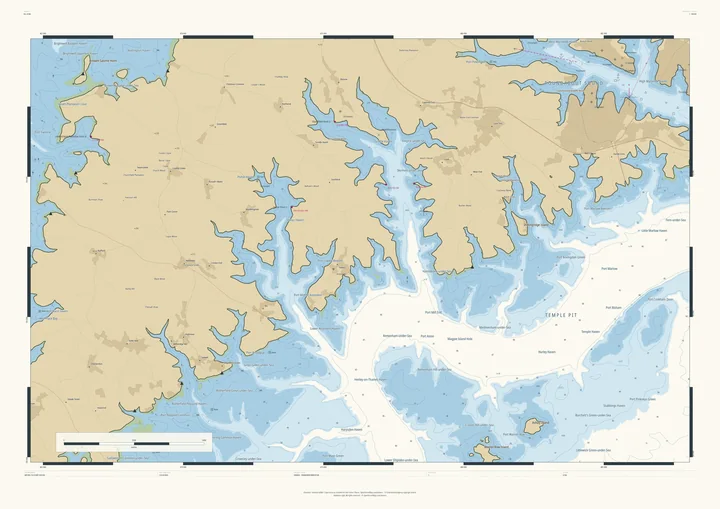
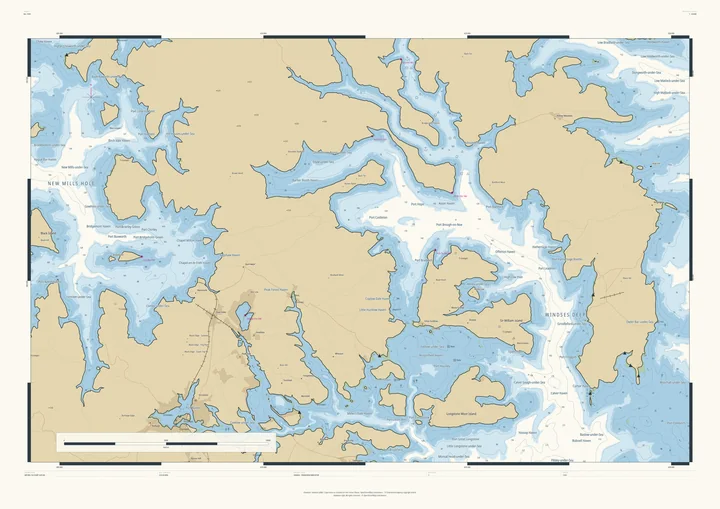
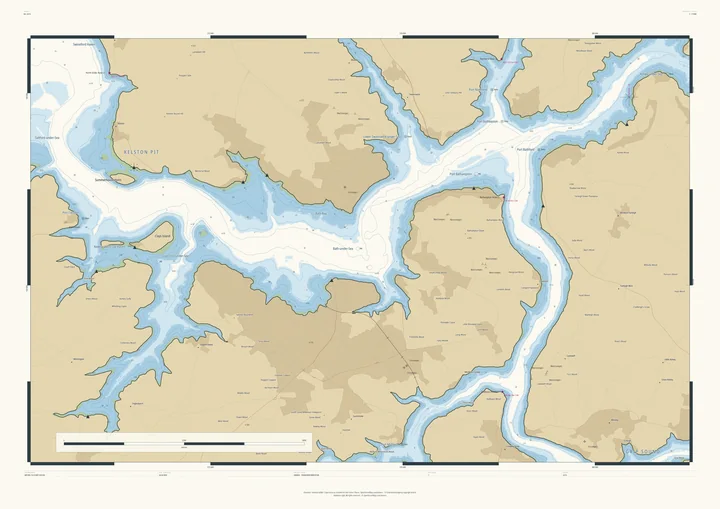
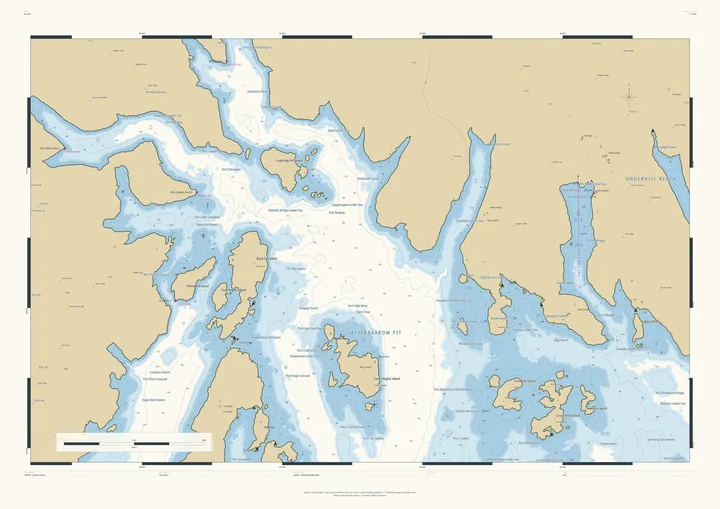
Choose a place, however far from the coast, and the Studio raises the sea until its valleys flood. Hills become islands and headlands, the valley floors become channels and sounds, and nearby villages give their names to the new harbours: Henley-on-Thames Haven, Edale-under-Sea, Port Bathampton. The result is drawn as a proper nautical chart in the Admiralty style, with soundings, depth contours, lights and a north star. About the style ↓
Every depth is real: a height measured from the air, turned upside down. The sea is not, and the chart says so. It is a gift for sailors who live inland, for rowers and walkers, and for anyone who would rather their village had a harbour. It works on real mountain coasts too: on Skye and Arran the sea simply rises, and the glens flood. Prints from £120; you see the finished chart, with your own title, before you pay.
Cumbria · sea at 381 m · 33 km across
The Lake District
The fells as a Norwegian coast of fjords and islands
Gloucestershire · sea at 208 m · 33 km across
The Cotswold Edge
The Severn Vale as open sea beneath the escarpment
Isle of Skye · sea at 145 m · 33 km across
Skye and the Cuillin
A real coast made wilder: the Cuillin as islands
Gloucestershire · sea at 188 m · 14 km across
Stroud and the Five Valleys
The Five Valleys as fjords running into the wolds
The Thames Valley · sea at 120 m · 24 km across
Henley-on-Thames
The Thames valley as a branching sea inlet
Derbyshire · sea at 310 m · 33 km across
The Peak District
The Dark and White Peak as an island coast
Somerset · sea at 64 m · 14 km across
Bath
The Avon as a winding sound beneath the city’s hills
The Lake District · sea at 205 m · 24 km across
Windermere and Ambleside
Windermere as a sea loch full of islands
Firth of Clyde · sea at 118 m · 33 km across
The Isle of Arran
Scotland in miniature, with its glens flooded
The Surrey Hills · sea at 121 m · 14 km across
Dorking and Box Hill
The Mole Gap as a sound beneath Box Hill
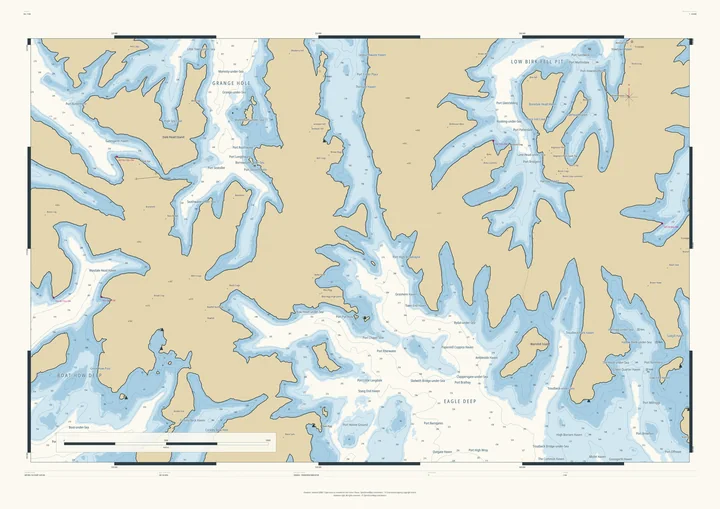
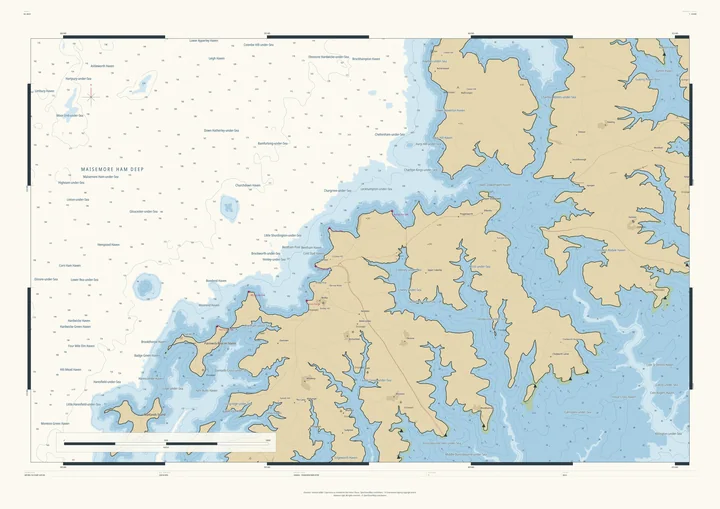
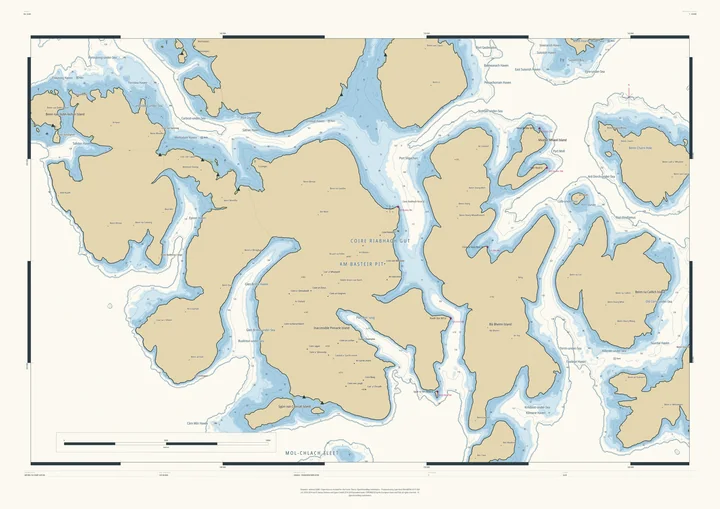
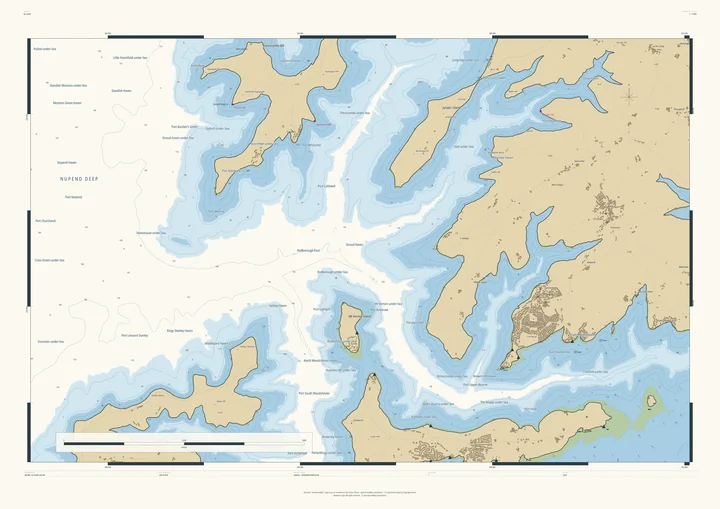
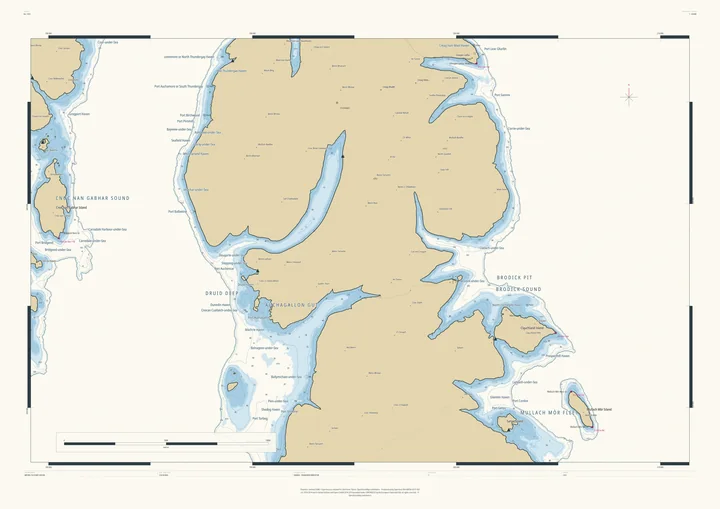
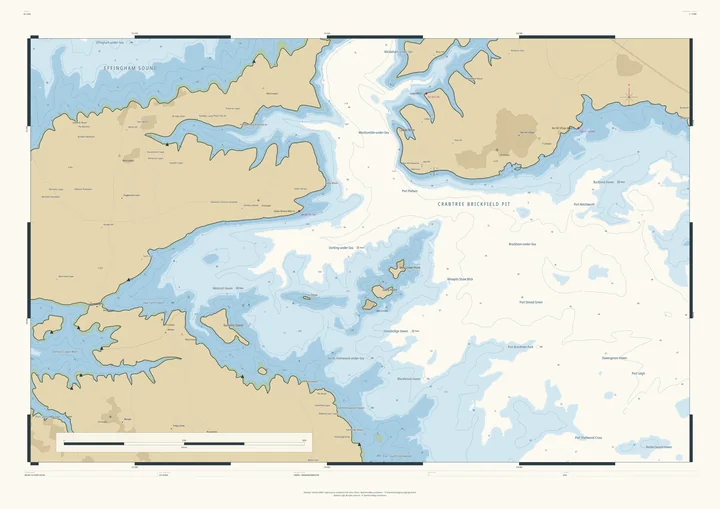
The style
After the Admiralty chart, borrowed with respect.
Drowned Coast is drawn in the manner of the British Admiralty chart. The Admiralty’s Hydrographic Office was founded in 1795, with Alexander Dalrymple as its first Hydrographer, and published its first chart in 1800. For more than two centuries since, its surveyors have charted coasts all over the world, and the Admiralty chart, with its quiet colours, dense small print and exact conventions, became the model for nautical charts almost everywhere.
We have kept the conventions a sailor would recognise, and applied them to water that isn’t there:
- Soundings
- The small figures scattered across the water: depths in metres below chart datum. On a Drowned Coast chart each one is a real land height, measured from the air and turned upside down.
- Depth contours
- Fine lines joining equal depths, so the shape of the sea floor (here, the valley floor) can be read at a glance.
- Colour tints
- The Admiralty palette: buff land, green for ground that dries at low tide, blue for the shallows and white for deep water.
- Drying heights
- Underlined figures on the green: how far the foreshore stands above the water when the tide goes out.
- Chart datum & tide
- Depths are measured from a low-water datum set below the chosen sea level, with a tidal range of 3 metres, just as a real chart measures from low water.
- Lights
- Magenta light stars and their coded descriptions on headlands and harbour mouths, written the way a real chart describes a lighthouse: its flashing pattern, period, height and range.
- Names
- Sounds, pits, deeps, holms and havens, named the way charts name them, after the real villages, woods and farms nearby: Henley-on-Thames Haven, Kelston Pit, Edale-under-Sea.
- Furniture
- A north star, graduated borders, a scale bar, a title panel and a caution box, which here says plainly that the sea is invented and the chart is not for navigation.
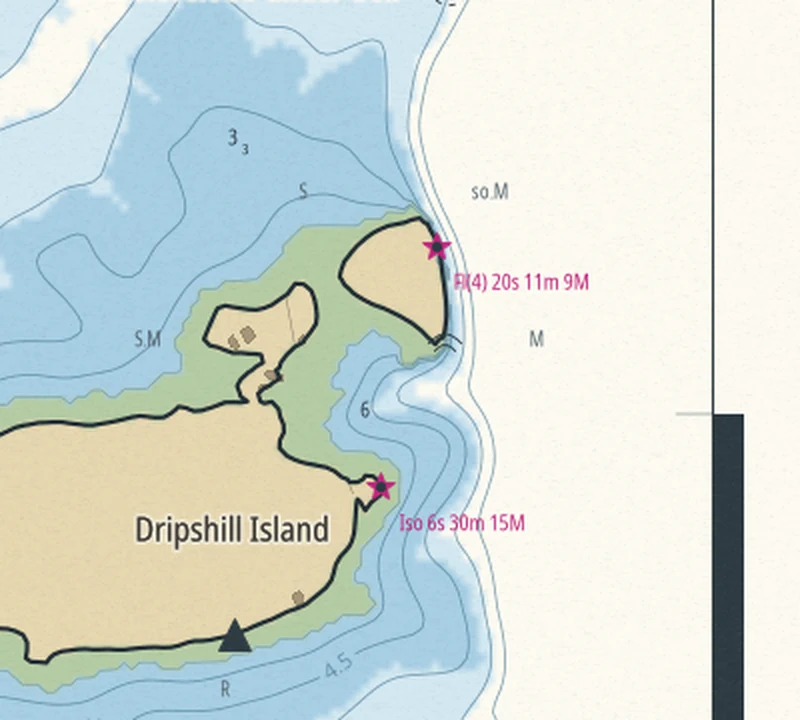
Terrain Studio has no connection with the UK Hydrographic Office, and Drowned Coast charts use none of its data. The style is a homage; the ground is measured; the sea is imagined.